• General

• General
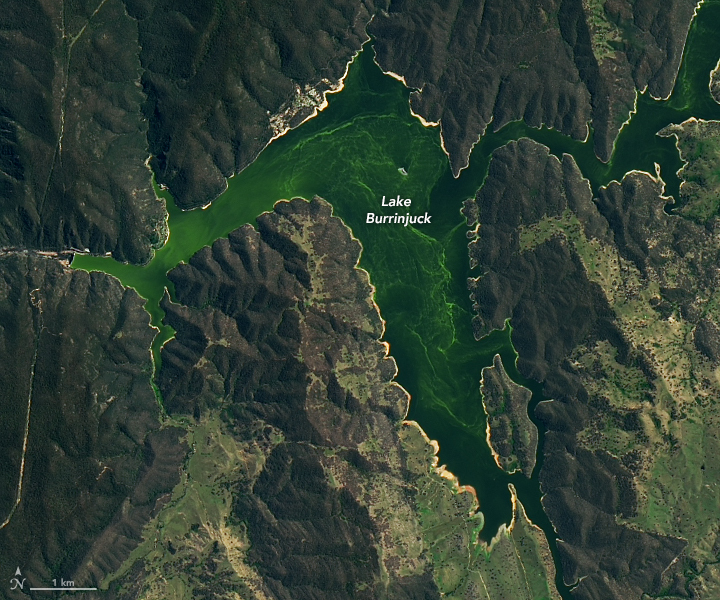
Two weeks ago, as an Image of the Day, NASA published an incredible satellite photo clearly depicting high concentrations of cyanobacteria — more commonly known as blue-green algae — swirled on the waters of Lake Burrinjuck in New South Wales, Australia. In an accompanying photo with a wider view, evidence of blue-green algae being fed into neighboring tributaries can be seen.

NASA Earth Observatory photo capturing algal bloom.
(CREDIT: NASA, Feb10, 2021)
Captured on February 10 of this year, the satellite images were taken in the midst of an algal bloom that began in late January 2021, when warnings were posted and bans on recreational water activities were put in place. As of the beginning of March, with algal concentrations in decline, people were advised to partake in activities on the lake with caution, being careful not to consume the water.
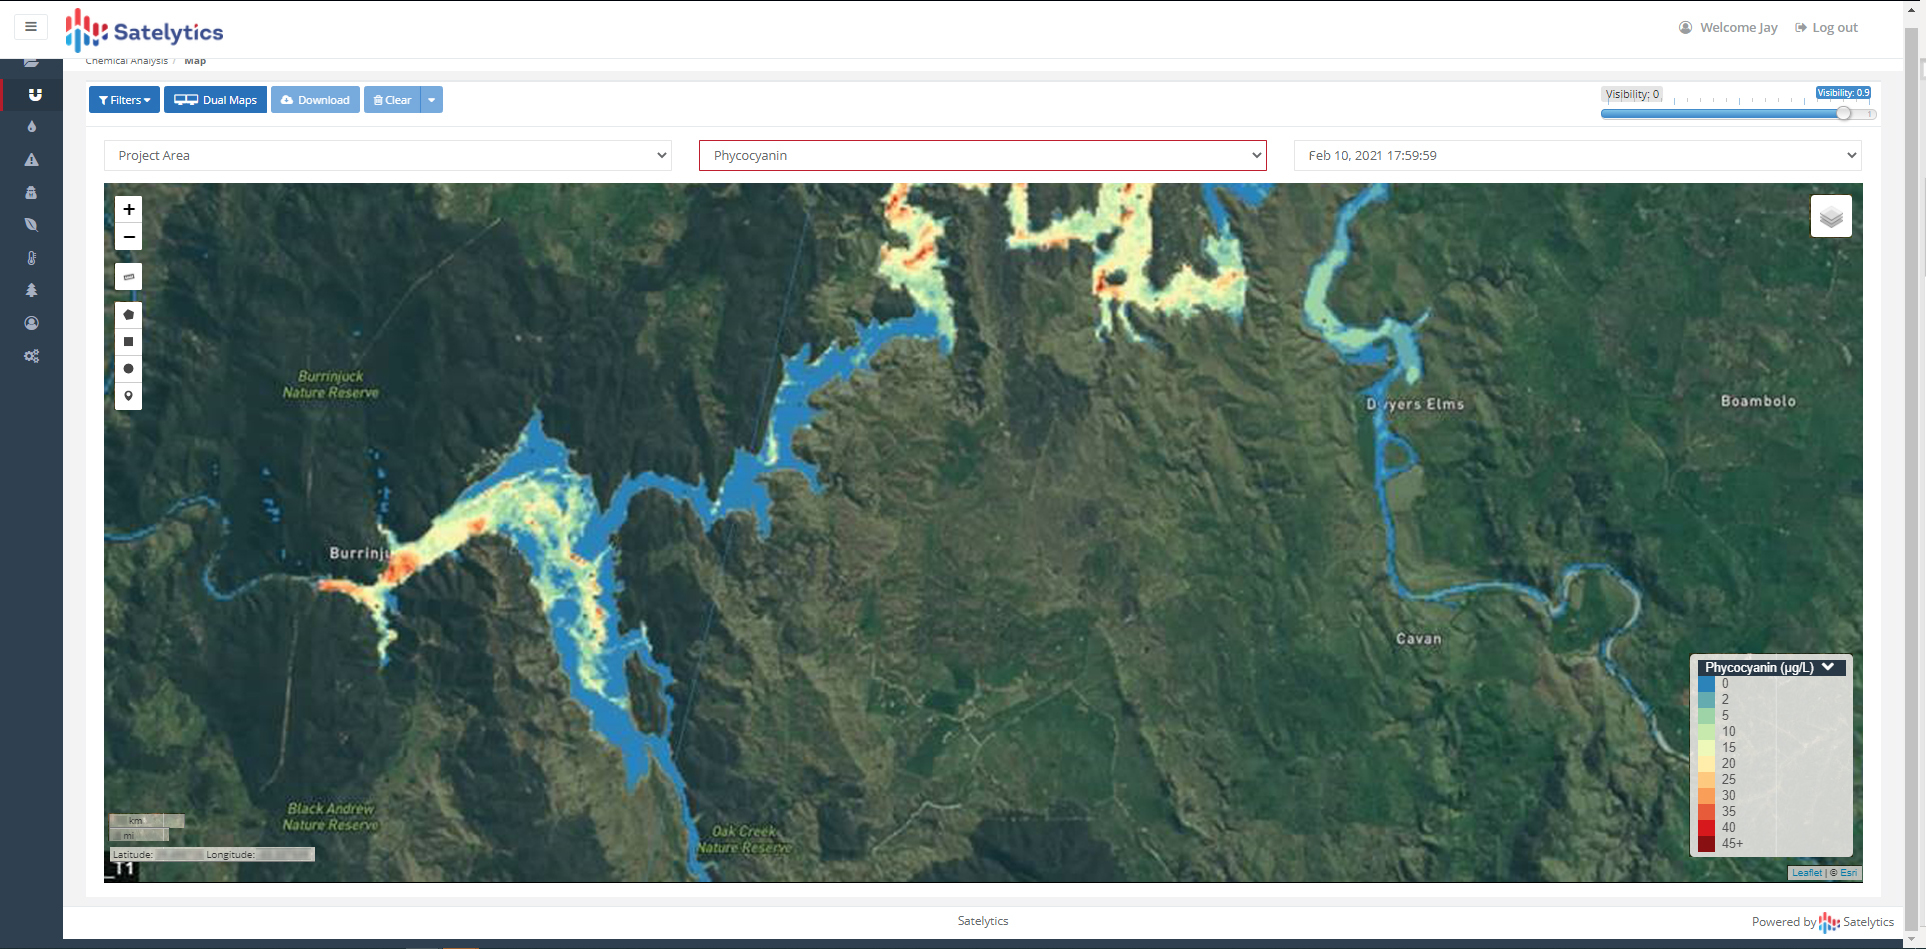
On the water’s surface, blue-green algae is usually easy to spot with the naked eye or through captured imagery — especially in the highly-concentrated case of Lake Burrinjuck. The satellite imagery NASA shared are examples of remote sensing — observing objects and phenomena from a distance, without physical contact. Satelytics goes several steps further by applying geospatial analytics to the imagery to wring more information from it.

Satelytics analysis of the same area, same date.
It goes without saying that allowing cyanobacteria to bloom as abundantly as it did in a freshwater source like Lake Burrinjuck can be extremely dangerous. As it reproduces and increases in concentration, blue-green algae releases cyanotoxins, creating a harmful algal bloom (HAB). Cyanotoxins pose serious health risks for animals and humans alike, often poisoning and even killing. Though individual blue-green algae only survive a few days, they pose a threat even in death. Dead algae sink to the bottom of a waterbody, where they are decomposed by other bacteria. In high enough concentrations, this causes the depletion of oxygen in the water, suffocating fish en masse.
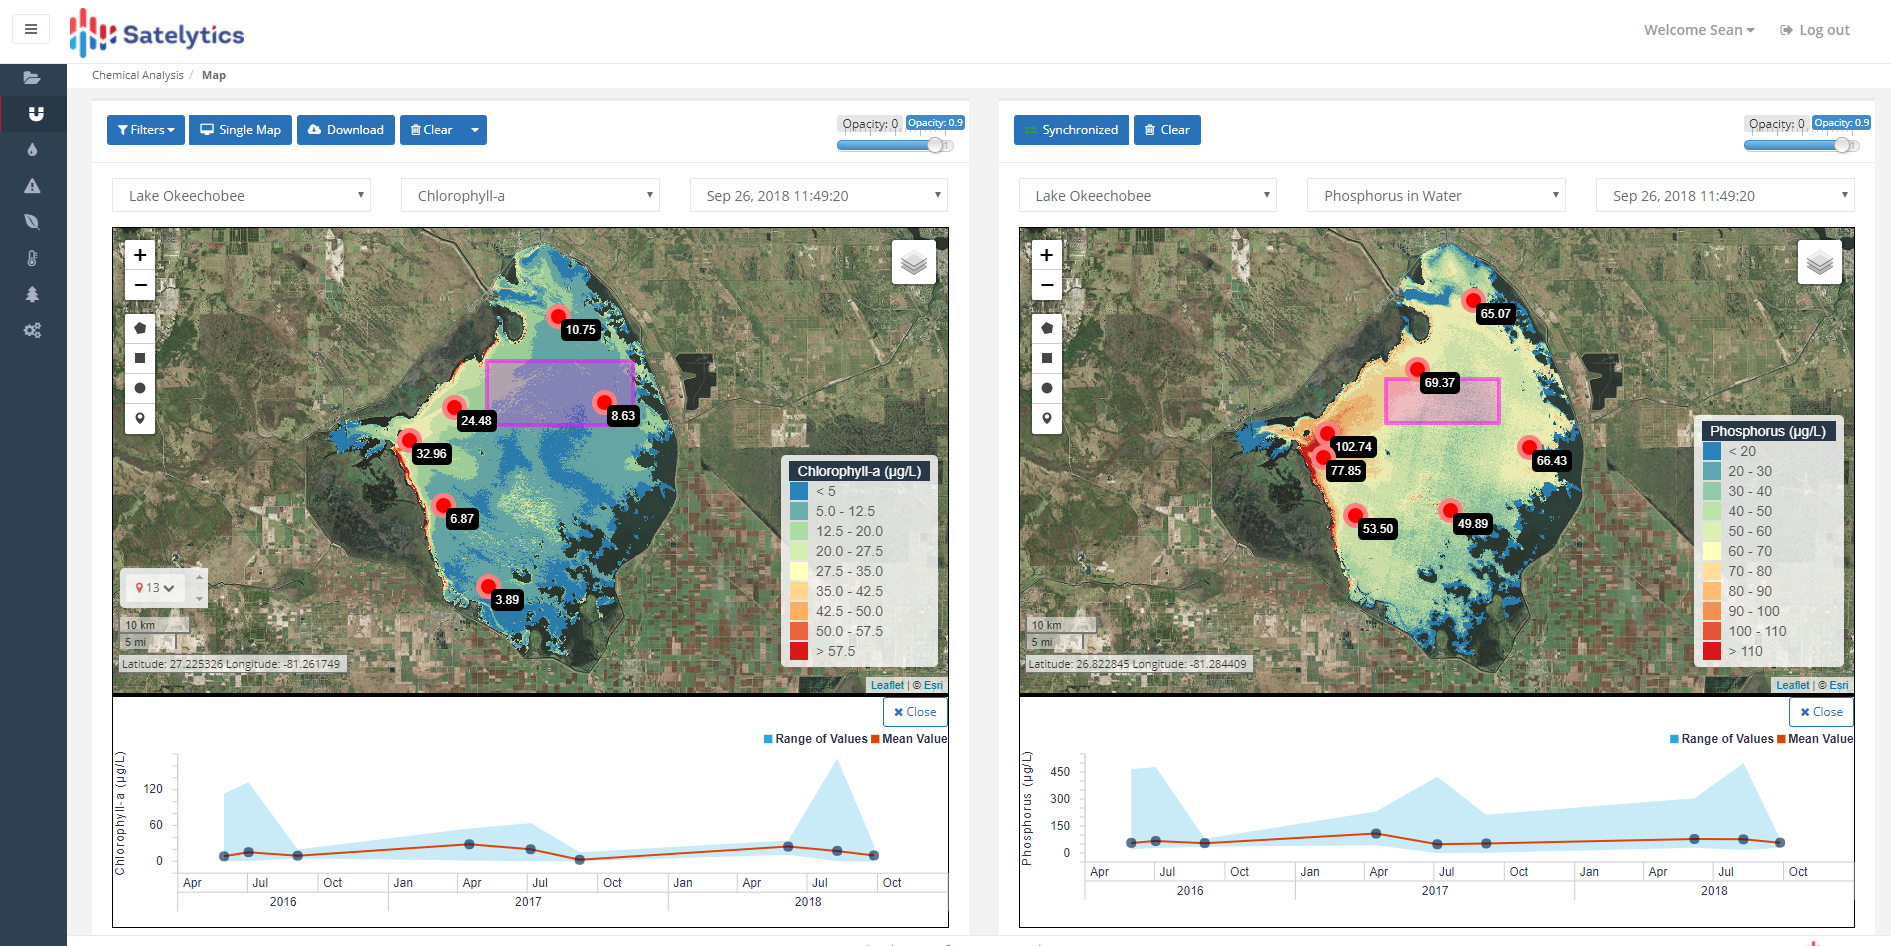
Early detection is key to preventing loss of life and damage to ecosystems. That’s where Satelytics and the geospatial analytics we employ come into play. Satelytics analyzes imagery like the satellite images NASA published to not only show customers where cyanobacteria is located in a waterbody, but also quantify the amount, providing actionable alerts to our customers in informational maps, text messages, email notifications, and more.

Satelytics analysis of an algal bloom and nutrient loading.
Satelytics' software is designed to provide these alerts to point interested parties to the root of the problem — at inception, not days or weeks later. Satelytics’ imagery of Lake Burrinjuck looks different because it’s more informative and paints a clearer picture of what’s happening. While a satellite photo looks impressive, it can’t rival actual quantitative results derived from analyzing the imagery.
With quantitative information, delivered immediately, we can act on problems!