
• Electric & Gas Utilities
• Electric & Gas Utilities
We often say with a coy smile, “We are pretty good propeller heads, but we aren’t experts in the details of your business." For example, we’ll never understand utility vegetation management as well as those who do it for a living, but we’re confident we can provide dramatically disruptive tools to those who can wield them with expertise.
During project kick-off meetings with customers, we always stress the importance of feedback. Recently, a couple of customers have provided feedback that has led to software changes tying Satelytics’ results more directly to the needs of utility vegetation managers.
Your Results, Your Way
One of our customers recently expressed concern with how our results are presented. They were pleased with the accuracy but said that tens of thousands of individual tree alerts didn’t help their vegetation managers respond efficiently to the alerts provided. We asked, “So, how would you like these alerts presented?” Their answer educated us. They said, “Some end users like the individual alerts, but others want them rolled up to ‘span alerts.’ Further discussion revealed that they really wanted results presented in a variety of ways for different end users at different points in the process.
Our solution: we now present alerts, selectably, as single trees, pole-to-pole spans, grids, or even circuits. Think of it as a knob to turn to present results at different summary levels. Your results, your way.
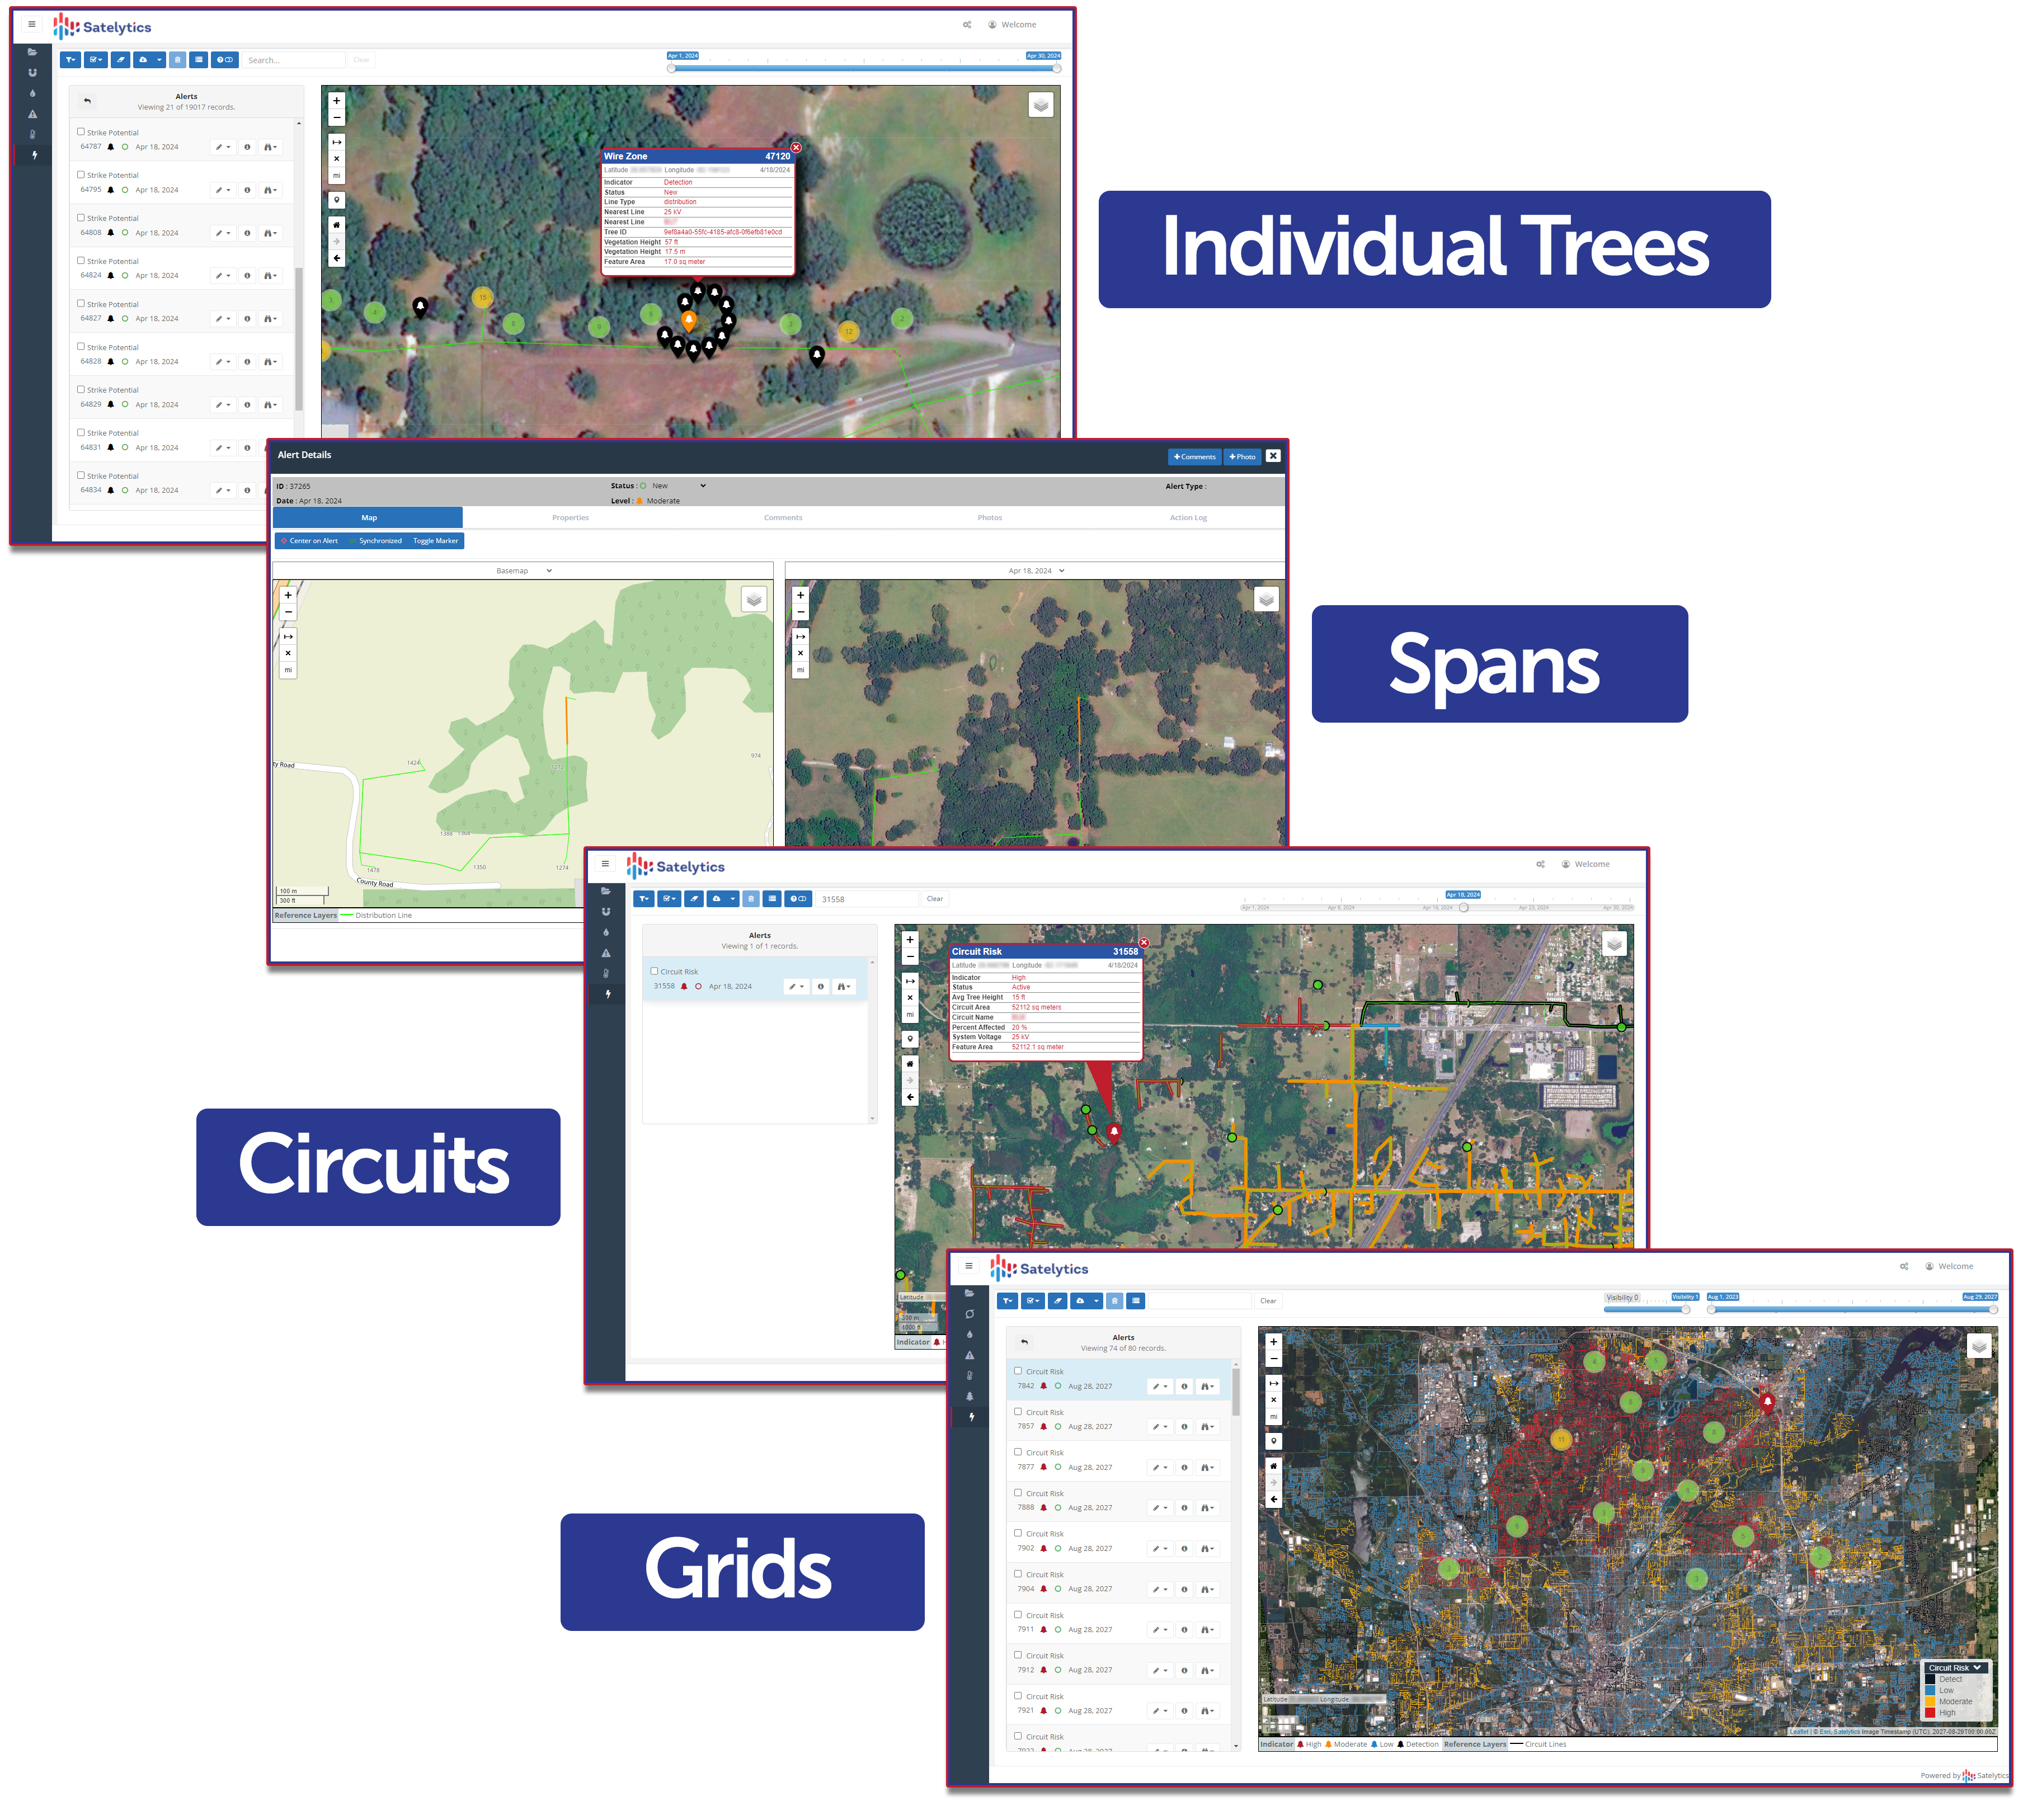
Your results, your way.
Pressing the “Easy” Button on Feedback
Other users reported to us that they had difficulty finding the tab within the software that facilitates entry of feedback from field crews. We thought we had made the user interface easy and intuitive, but if the customer disagrees… we are simply wrong.
Our solution: we have now made minor adjustments to the menu bar within our software to make the feedback mechanism more prevalent. More importantly, we also reorganized how feedback is presented to the user, making it easier to identify where feedback has already been provided.
Map View More Relevant to Field Crews
We tend to default to showing analytical results against a natural color background because it makes for impressive pictures. But, field crews have expressed a preference for starting in a street map view.
Our solution: Voilà! Your vegetation management project can now be set to represent results in street map view by default. It is a small change, but it seems significant to our customers.
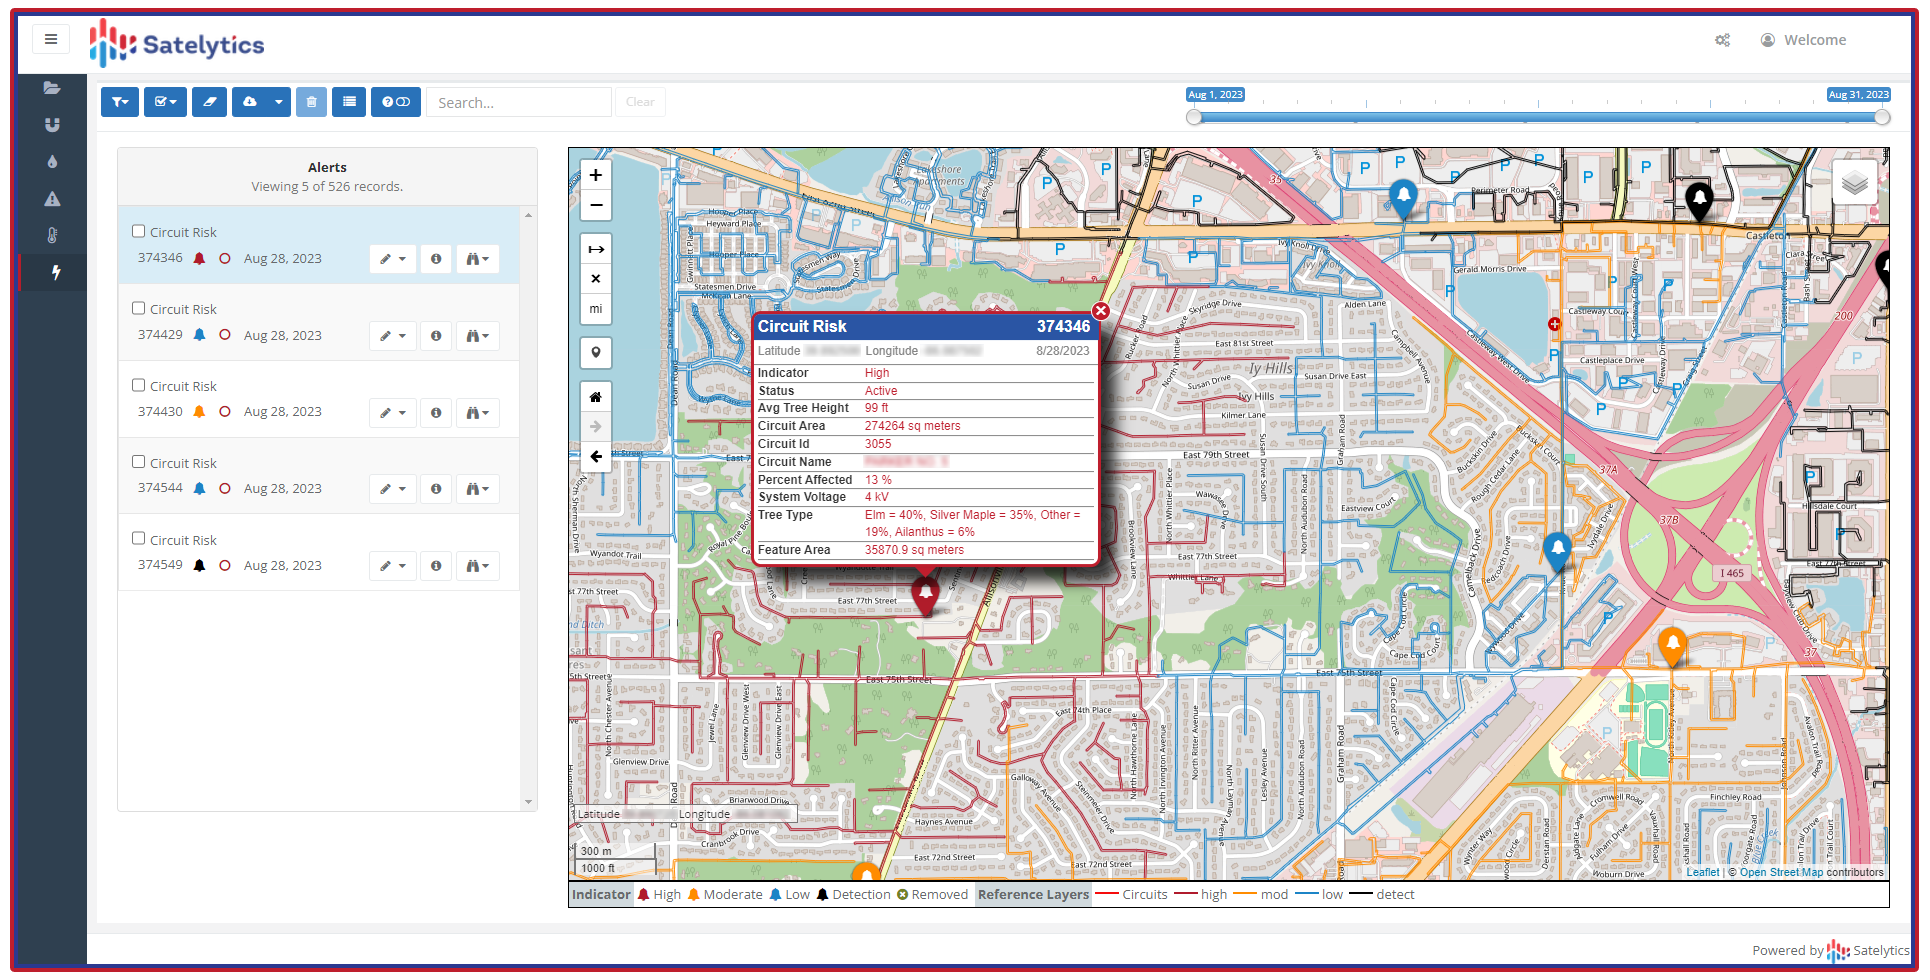
Prefer a street map instead of a natural color imagery view? Easy peasy.
Saving the Best for Last
Maybe the most impressive of the changes we’ve made to extend the functionality of our software is that vegetation results can now be presented in a three-dimensional view. Revealed in February at DISTRIBUTECH, this feature received some ooohs and aaahs. Customers tell us that this feature has the potential to greatly assist field crews in planning their fieldwork, especially in difficult terrain.
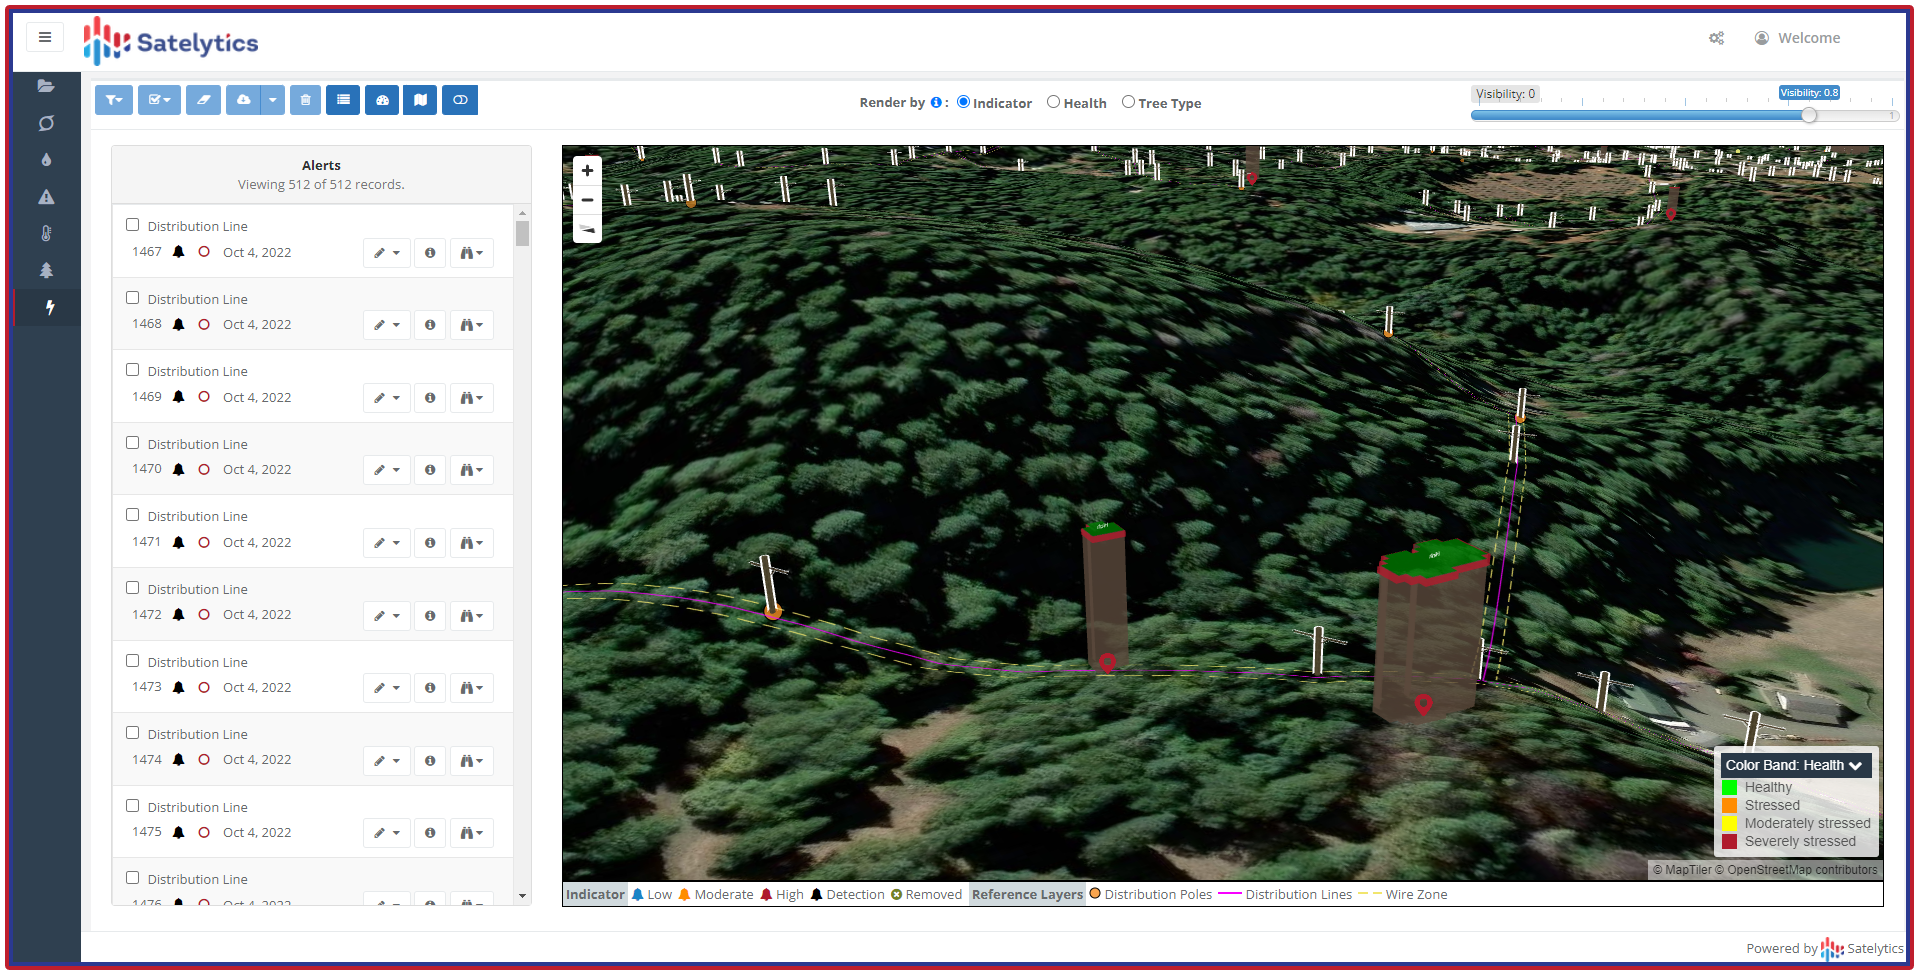
Exciting 3D interactive views.
Satelytics doesn’t just want customer feedback. We need it to ensure we are addressing your most pressing challenges. Call us today to give us your feedback.
We use cookies to analyze our web traffic and to enhance your experience. By continuing to view this website, you agree to our use of cookies.
Our Privacy Policy